Synopsis
In Lecture 3, we wrote a MATLAB program that interacts with users via the keyboard and print statements. In this class, we will create a different program that works with files. The topics for this lab include file I/O, functions with multiple arguments, plotting, and plot formatting.
Daily Quiz
2014 Ebola Outbreak in West Africa
In 2014, we witnessed the worst outbreak of Ebola in history 1. The World Health Organization (WHO) in conjunction with the Center for Diseases Control and Prevention (CDC) recorded over 28,000 suspected, probable, and confirmed cases across Guinea, Liberia, and Sierra Leone. The goal for this lab is to use MATLAB to mine data from WHO and CDC 2. We will be determining the number of Ebola survivors from the reported numbers of Ebola cases and deaths, plotting the cumulative survivor data, and writing this data to a file. It is important to note that this calculation is being performed to help us learn how to work with data files, and we should not draw conclusions from our results alone.
Getting Started
To begin, we must first examine our data files. Take a moment to download and inspect the two files containing the number of cases and number of deaths in Guinea, Liberia, and Sierra Leone.
ebolaCases.csv
ebolaDeaths.csv
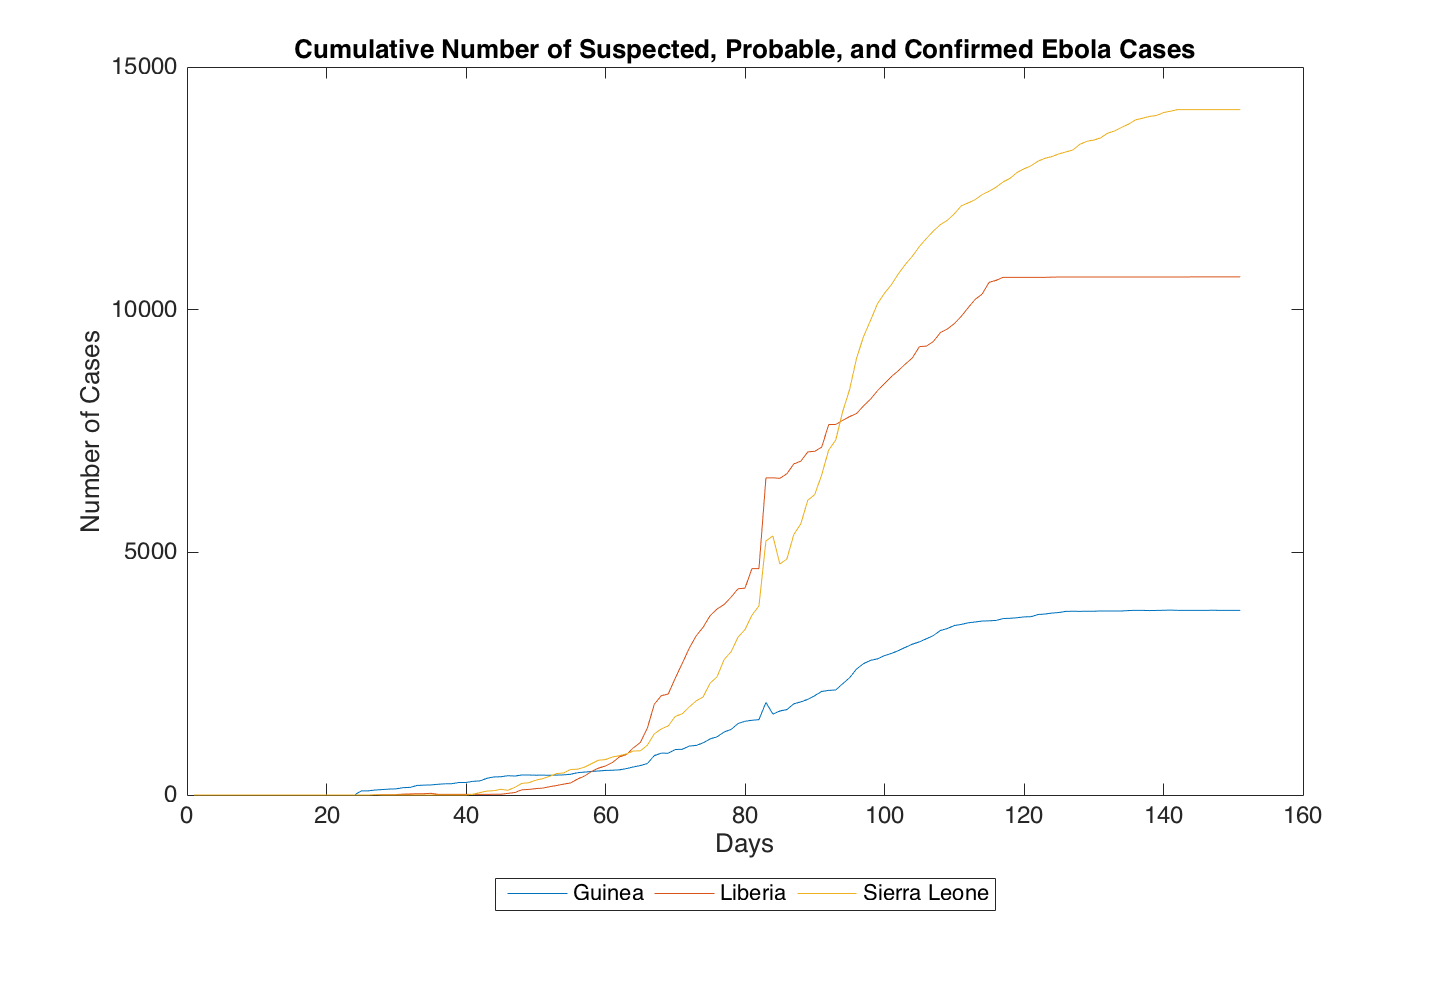
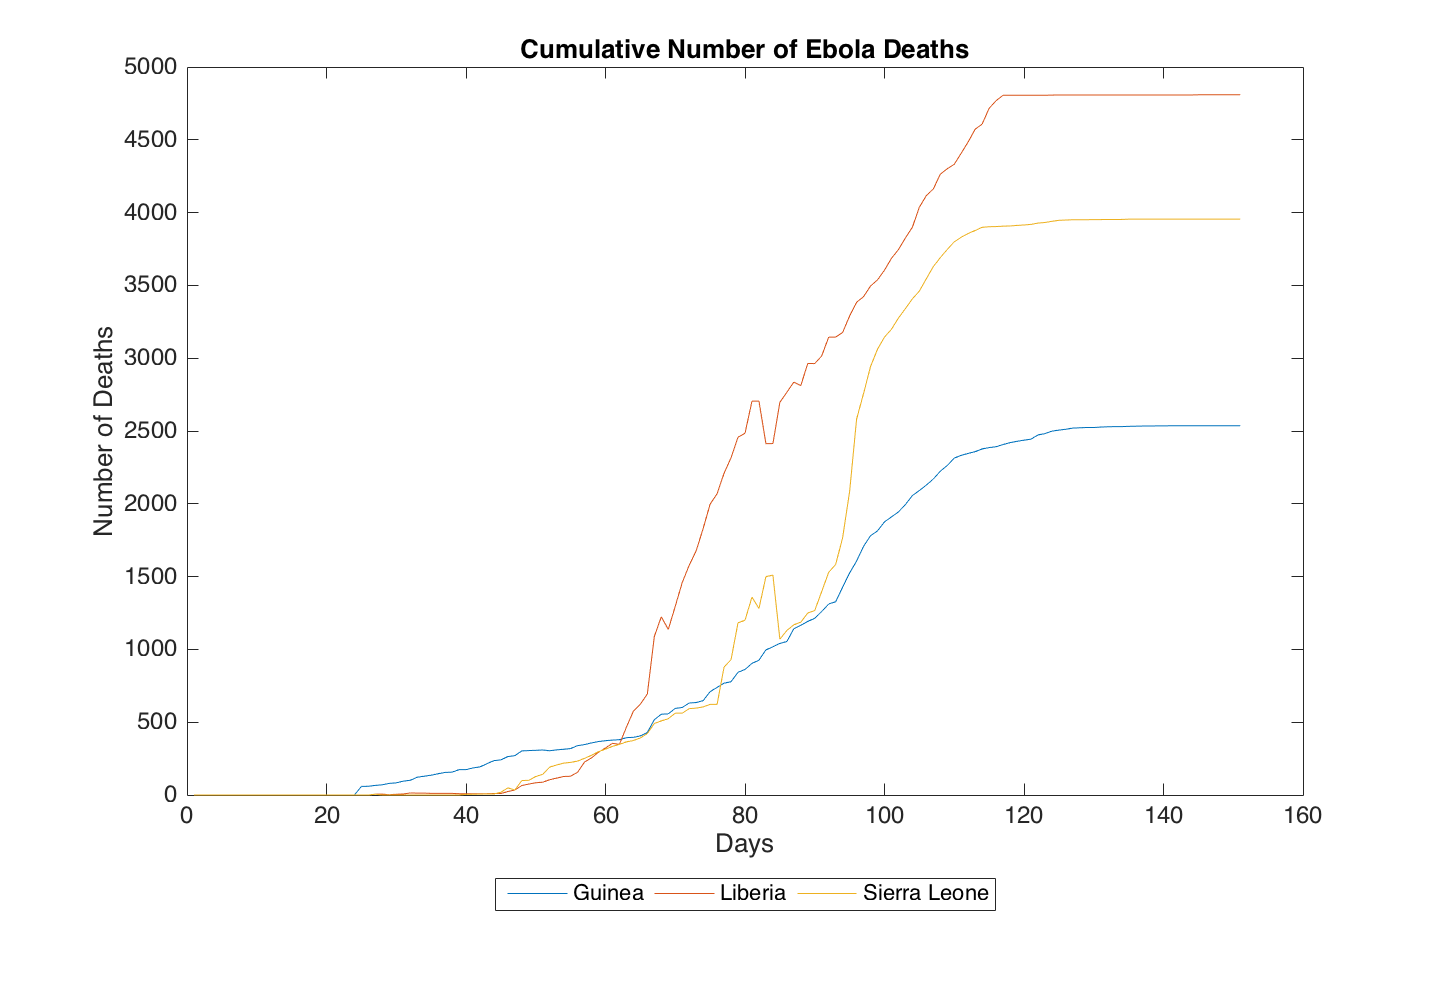
These two file names end with the extension .csv which stands for comma separated values. This means that the numbers in each file are delimited by commas. CSV files are a common file type when dealing with numerical data. As you will see, each file contains 151 rows and 3 columns. Each row corresponds to a single day, and each column corresponds to a different country (Guinea, Liberia, and Sierra Leone, respectively). The top row starts at the date 3/1/2014 and ends at 1/13/2016. The numerical data are either the cumulative number of suspected, probable, and confirmed cases or the cumulative number of deaths. Below are two plots to help you visualize the data store in each file.
Algorithm
We can begin to think about our algorithm by first redefining the goal. We would like to calculate the number of survivors, plots the results, and save the data to a file. Since we are starting with two files, we must first load these files into MATLAB. Then we can perform our calculation, plot, and save the data. With that in mind, let's formally define the steps of our algorithm.
- Load data from CSV files into MATLAB
- Perform survivor calculation
- Plot survivor data
- Save survivor data
These are the steps we need to follow in order to produce our desired MATLAB program. Take a moment to think about how you will tackle each step. I provide some hints about each step below.
Step 1: Load
Before we start writing, we need a place to put our code. Create a new script called ebolaSurvival.m. Add the appropriate comments to explain the purpose of your script. Then begin a new code section using %% to load the CSV files. Use the doc function to learn how to load each file. Be sure to assign the file contents to a variable (one for each file) for use in the next steps. Test out your code using Run Section.
When you've successfully loaded the data into a variable, use the Workspace window to inspect the dimensions of your data. Do these dimensions agree with the description above?
Step 2: Survivor Calculation
Let's get some practice with writing functions by performing our survivor calculation with a dedicated function. Create a function file named calcsurvival.m (hint: remember that the file name should match the function name). Your new function should accept two arguments--the matrix of reported cases and the matrix of reported deaths. The output of your function should be the number of survivors. Be sure to replace the default function comments with the appropriate information about your code. Now you can write the expression to determine the number of survivors from the number of cases and the number of deaths.
With your function written, you can now call calcsurvival from your ebolaSurvival.m script. Add this function call to a new code section, and test it out using Run Section.
Step 3: Plotting
We now need to plot the results in a new code section. This is an area where you can get creative. There are many different formatting functions that will let you customize your plot to your liking. As a minimum, your plot should have a title, x- and y-axis labels, and a legend. Search the MATLAB documentation using these keywords to find the functions you need to accomplish each formatting task. To get started, pass the results of your calcsurvival function to the built-in function plot. This should produce a line plot with three separate lines (recall: the columns represent the countries of Guinea, Liberia, and Sierra Leone).
Step 4: Saving Data
With your plot nicely formatted, we can now perform the last task--saving the survival data to a file. In this step, we are aiming to produce a file similar to those that we loaded at the beginning of this lab. Use the doc function to learn the syntax for saving data, and then create a new code section to save an ebolaSurvival.dat file. When you are done, open the file to see how it is formatted. How does it differ from the input files?
Wrapping Up
When you have finished your MATLAB program, you can upload your files to your cs130r directory. For multiple files, I recommend compressing your data into a .zip or .tgz file. Be sure to write a README.txt explaining what each file does and how to run your code. Below is an example README.txt file
DATE CREATED: 2016-02-03
LAST DATE UPDATED: 2016-02-03
AUTHOR: JANE DOE
COURSE: CS130R - Spring 2016

This directory contains MATLAB code and output generated for Lab 2.

INPUT
ebolaCases.csv    -   data file containing the cumulative number of cases per day (rows) in Guinea, Liberia, and Sierra Leone (columns)
ebolaDeaths.csv   -   data file containing the cumulative number of deaths per day (rows) in Guinea, Liberia, and Sierra Leone (columns)

CODE
ebolaSurvival.m   -   MATLAB program that loads the two input files, calculates the cumulative number of Ebola survivors, plots a formatted graph, and saves the survival data to a file.
calcsurvival.m    -   MATLAB function that calculates survival given the number of cases and the number of deaths.

OUTPUT
ebolaSurvival.dat -   data file containing the cumulative number of survivors per day (rows) in Guinea, Liberia, and Sierra Leone (columns)

EXECUTION
This MATLAB program is executed by placing the input and code files in the same directory, and running the ebolaSurvival.m file. A plot will be displayed and a data file will be saved to the directory containing the code and input files.
Answer Key
Code
ebolaSurvival.m
calcsurvival.m
Output
ebolaSurvival.dat
Final Words
Congratulations! You've now written your first MATLAB program. File handling and plotting are fundamental skills in MATLAB, and you will be developing them further throughout the semester. You will find that there are many different data file types, and MATLAB has functions to handle most formats. In coming classes, we will be using your new skills to tackle more complex data mining exercises.